Simulation setup & far-field calculation
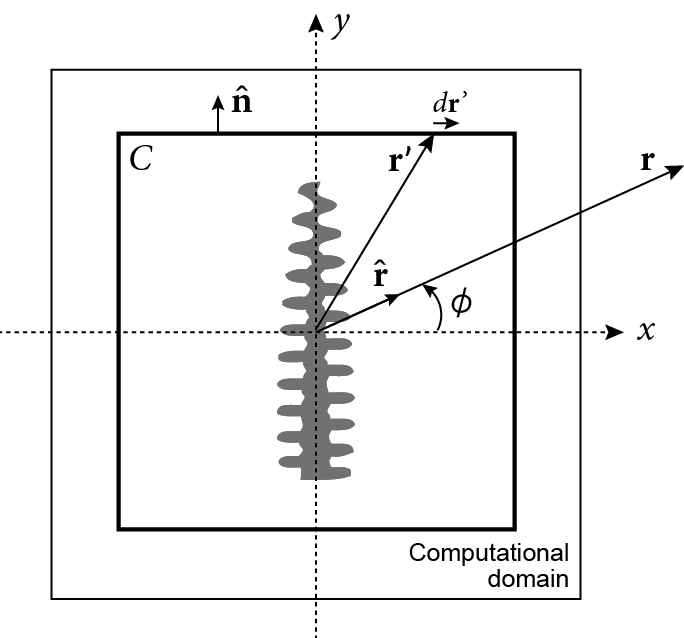 Fig. 1. Setup to calculate the near-to-far field transformation. r is a position vector in far-field,ř = r/|r|, φ is the reflection angle, C is a closed integration path, r' is a position vector on C, ň is a unit vector normal to C, and dr' is the perturbation on C. We first solve the full form of Maxwell's equations using the NS-FDTD method to simulate the near-field reflections of a single averaged ridge in both the transverse electric (TE) and transverse magnetic (TM) modes. The simulation parameters are listed in Table 1. The computational domain is terminated by the nonstandard perfectly matched layer absorbing boundary condition (8-layers) [OC11]. Since the reflectance is measured in far field, we use the near-to-far field transformation [LRB92] to obtain the reflectance in far-field. The far-fields are given by (see Fig. 5) where Z = √ (μ/ε) (μ = permeability, ε = permittivity) and φ is the angular cylindrical coordinate. In Cartesian coordinates, N and L are defined by 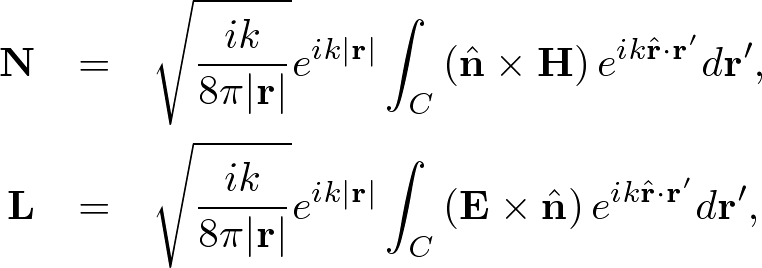 . . . (2) . . . (2)where r is a position vector in far-field, ř = r/|r|, C is a closed integration path, r' is a position vector on C, and ň is a unit vector normal to C. The transformation of N and L from Cartesian to cylindrical coordinates is given by The reflectance R for each angle φ is given by Comparison of FDTD results with measurement dataFor all visible wavelengths λ and over all incidence angles θ, we obtain the anisotropic reflectance distribution, R(λ, θ, φ). These calculations took about 10 hours on an Intel Core 2 Duo 2.66GHz parallel CPU. 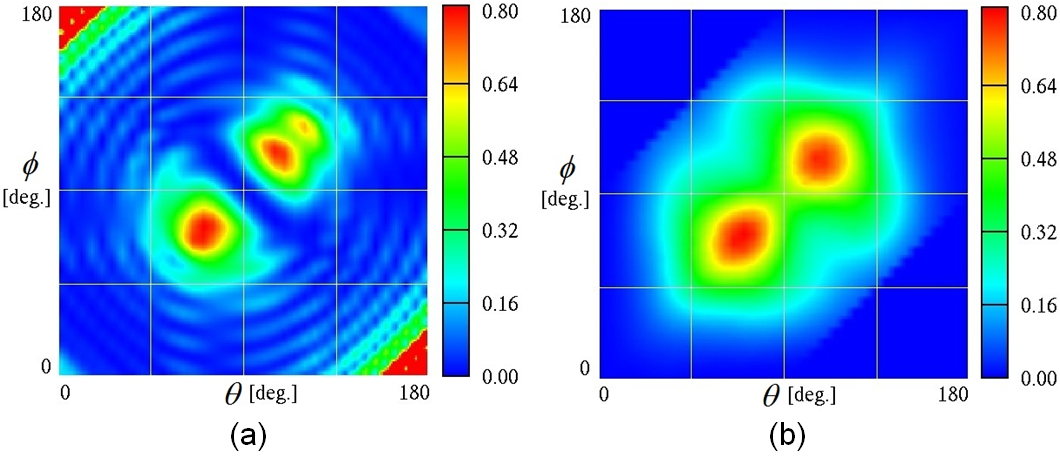 Fig. 2. The reflectance distribution at wavelength = 480nm (θ = incidence angle, φ = reflection angle). (a) Reflectance distribution computed by NS-FDTD simulations using a single averaged ridge. (b) Experimentally measured reflectance distribution of a 5 × 5mm2 Morpho wing sample [KZK11]. Color bars indicate the reflectance ratio. Figure 2(a) shows the reflectance distribution R computed using the NS-FDTD simulation for blue light (wavelength = 480nm). Figure 2(b) shows the experimentally measured R using a male Morpho rhetenor wing sample. In the experiment, the wing sample was 5 × 5mm2 and the all-angle reflection method was used [KZK11]. Both the simulated and measured results succeed in capturing the backscattering which cannot be obtained by the diffraction super position model [KYFO02]. In the experimental measurements, there is no light is transmitted because the many taper-shaped ridges channel light into the back of the wings. This has only a small effect on the rendered images due to Lambert shading as discussed later.  Fig. 3. Backscattering in simulation of the TM mode (wavelength = 480nm). Black region is a single averaged ridge model. (a) Parallel beam is incident at θ = 75°, indicated by white arrows, at time = 3 wave periods. (b) Scattered waves interact with each other as they propagate along several direction at time = 6 wave periods. (c) Interference causes backscattering indicated by white arrows at time = 15 wave periods. We can observe the backscattering in near-field distributions. Figures 3 show an example calculation of the scattered electric field distribution with blue light backscattering (wavelength = 480nm) in the TM mode. In Fig. 3(a), a parallel beam impinges on a single ridge model at an angle of θ = 75°. Figure 3(b) shows interference by scattered waves after 6 periods. Figure 3(c) shows strong backscattering after 15 wave periods. This is due to the staggered lamella structure as discussed before. 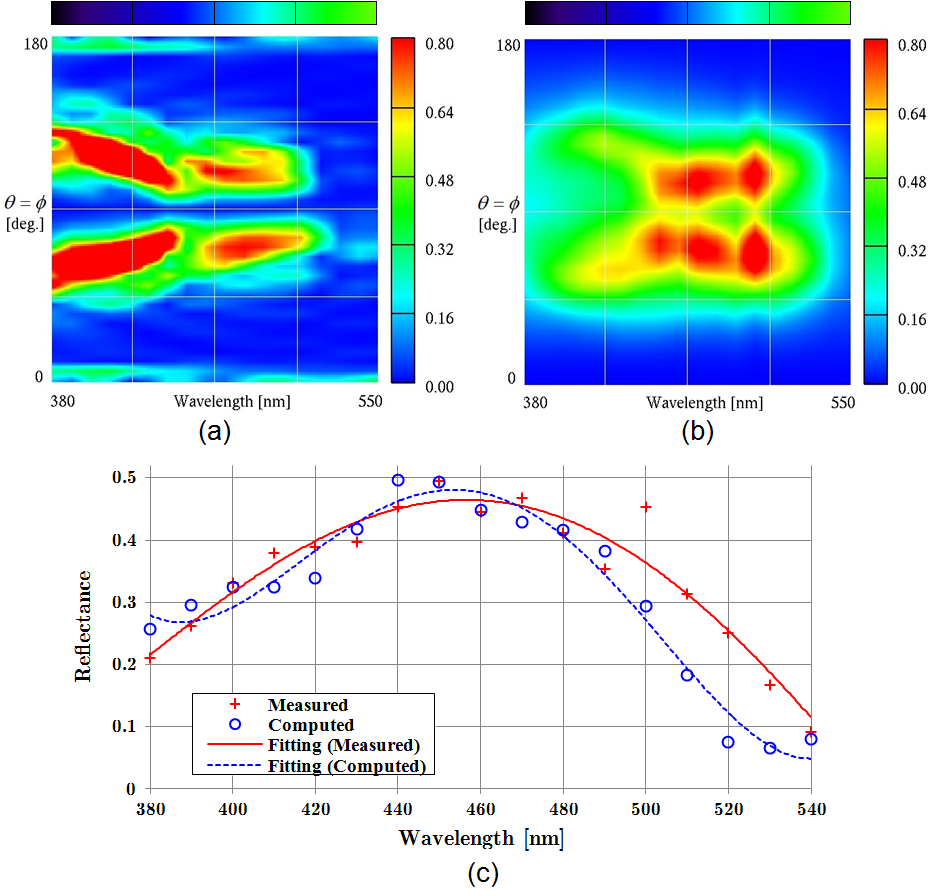 Fig. 4. The reflectance spectra of Morpho butterfly scales. (a) Computed and (b) measured [KZK11] spectrum distributions at θ = φ (upper color bars denote incident light color, right bars show the reflectance ratio). (c) Angular-integrated reflectance spectrum with fitting curves at θ = 90°. We compare the calculated reflectance spectrum with the experimental measurement [KZK11]. Figures 4(a) and (b) show reflectance spectra along the backscattering diagonal θ = φ line. As the figure shows, the simulation results and experiments differ at short wavelengths because the shorter wavelength, the greater the destructive interference between many ridges of random height. Fortunately the reflection at short wavelengths has only a small effect on the rendering of structural color, because the spectral power of daylight is relatively small in these wavelengths. Figure 4(c) shows reflectance spectra integrated over reflection angle (φ = 0 ∼ 180°) due to normally incident light, with fits to the data. Our computed angular-integrated spectrum agrees better with the experimental measurements than conventional simulations [ZKCC09] [LS09], especially in the strongly reflected blue region. Thus, using these computed results, we can produce a more realistic Morpho butterfly CG. Bibliography:
Copyright (C) 2011 Naoki Okada, All Rights Reserved.
|